The enterprise and the speculation.
When it comes to investing and, implicitly, the expectation that we have on future rates of returns, a distinction between enterprise and speculation follows. By enterprise we refer here to the development, in its real sense, of a business (i.e. its culture, employees, suppliers, customers, competitors and the evolution of its surrounding environment), whilst speculation is broadly used as an amalgam accounting for everything which can be considered outside an investor’s control (i.e. the variations in the price paid for each dollar of profit and, when applicable, in the relational value of currencies).
The concept treated in this brief article is far from novel: from John C. Bogle and Michael W. Nolan to François Rochon and, as recently as 2023, Michael J. Mauboussin, the deconstruction of shareholder returns has been extensively documented. Notwithstanding this, the average investor keeps paying too much attention to the overall movements in market quotations and often forgets how these originate, thus giving too much relevance to the non-controllable aspects of investing -which happen to account for most of the fluctuations over short periods of time.
The levers of market returns.
With a few nuances that we shall address later, the below equation depicts the constituents of shareholder returns on publicly traded securities. Note how the ΔEPS, ΔPER and FX components are geometrically linked:
TSR = (1 + ΔEPS) * (1 + ΔPER) * (1 + ΔFX) + DY
where TSR stands for total shareholder return, ΔEPS represents the increase in per-share earnings, ΔPER the variation in the earnings multiple, ΔFX the currency fluctuations and DY the dividend yield.
Although Mauboussin’s definition of TSR considers it to be strictly the case when dividends are reinvested, for the purpose of this text dividends are treated as cash that is not deployed back into the market (i.e. income).
Another detail worth mentioning is that per-share earnings (normalised or not) are used as a proxy of economic profit and, consequently, the price-to-earnings ratio as the valuation measure. As generalist investors, it is most common the case where the capital deployed uniquely represents a portion of the total pool of shares outstanding in any given business, thus per-share profits provide coverage for the effects posed by financial engineering mechanisms such as share issuances and buybacks.
Finally, note how the dividend yield is added to the total returns once converted to the investor’s currency. There are several reasons for this, the most relevant of them being simplicity in handling the different exchange rates between the local (i.e. the currency in which the cash distribution take place) and the investor’s currencies that may apply at different times. Put simply, the exchange rate between two currencies will most certainly not be the same at the times when the investment is made, the dividend(s) is(are) collected and at the end of the period over which the TSR is calculated.
Four levers are identified in the above equation. Two of them are, to a certain degree (the role that luck plays in our lives should never be understated), under the investor’s control. These are the growth in economic profits per share (ΔEPS) and the dividends collected along the process (DY). Their nature happens to be in line with what we referred to as “enterprise” in the introductory paragraphs, this is, the reality surrounding the underlying business.
The other two items constitute the more speculative part of investing: the change in the valuation multiple (ΔPER) and, when applicable, the fluctuations in exchange rates between the local and the investor’s currencies (ΔFX).
The usefulness of the TSR levers.
Deconstructing the TSR into its main constituents might be of good use for an investor aiming to make informed decisions but, is that really all that is about it? As it turns out, there are some profound implications that we can greatly benefit from by distinguishing what is driving the stock returns on any security or on the market as a whole.
By focusing on the enterprise, that is, on the increases in the intrinsic value of the business over time, the noise generated by the speculative components is effectively filtered out. The use here of the term “noise” is deliberate, as I strongly doubt there is any forecaster capable of finding a predictable pattern (with no hindsight as companion) in the swings that Mr. Market presents to us over the short term.
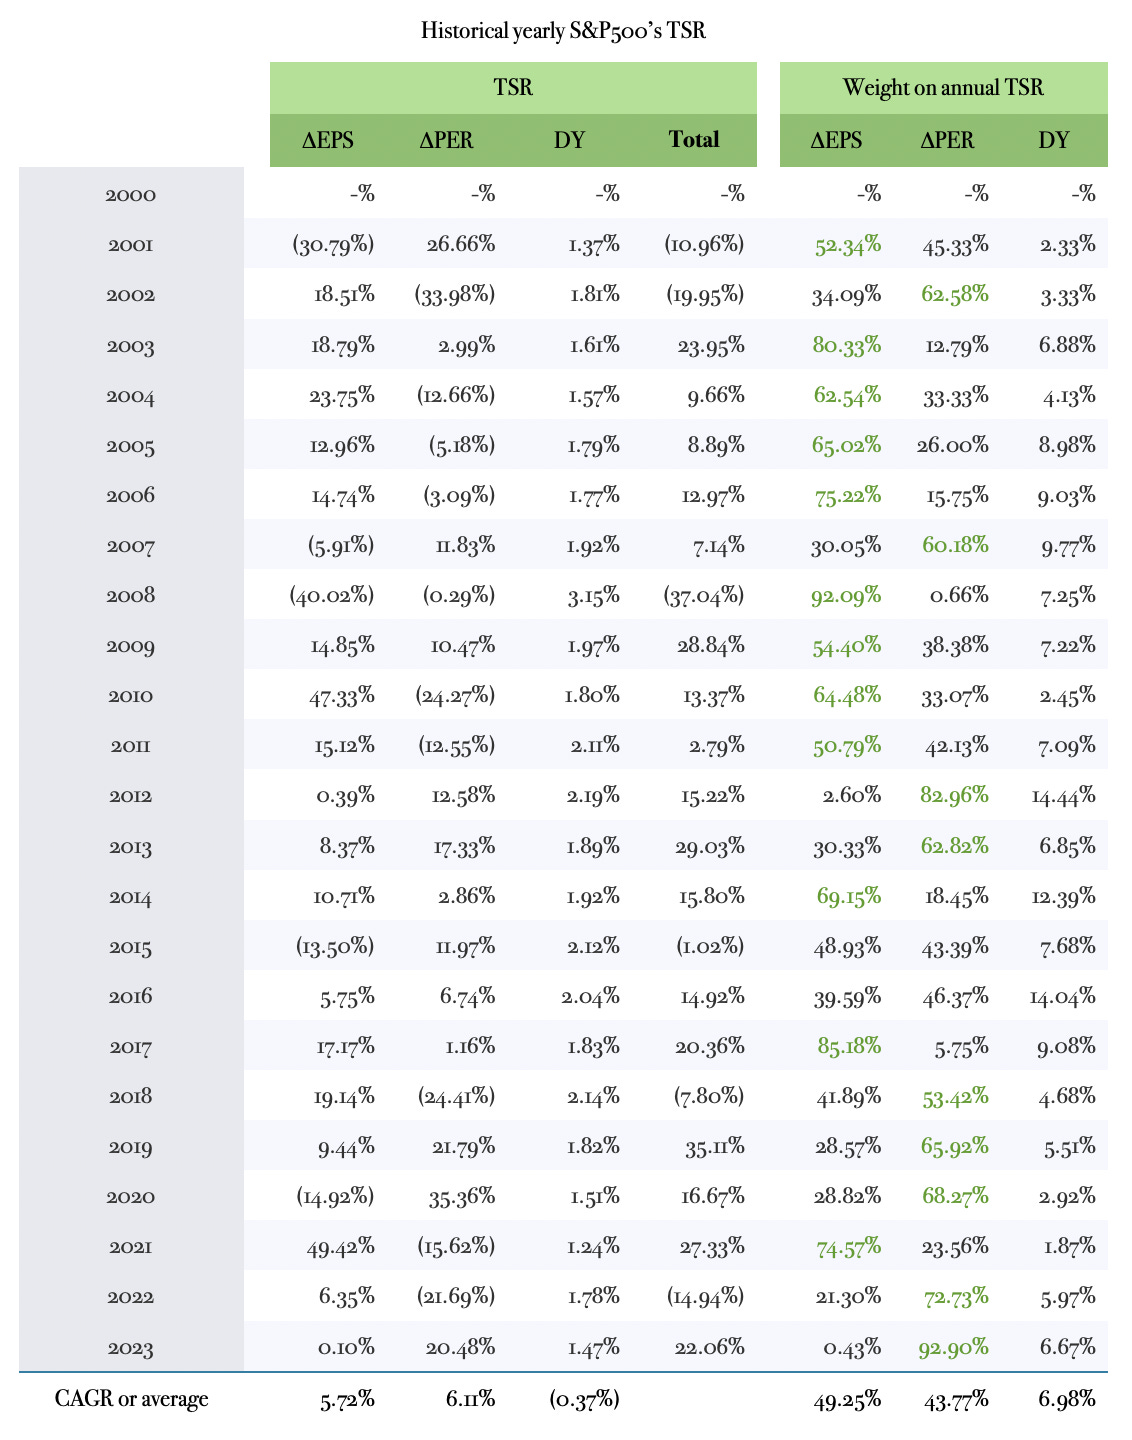
Not only the volatility associated to speculative returns is much greater than the one which derives from the enterprise side, but it also tends to bear the strongest influence on market performance over short periods of time. By contrast, given a sufficiently stretched time span, something truly magical takes place: the contribution that speculation has on market returns in certain years cancels out with the detraction that it poses in others, thus leaving its long-term performance incredibly close to the behaviour experienced by the enterprise (i.e. the reality of the business) in the same timeframe. Such effect extends to the point that, since the turn of the millennium, solely -0.4% p.a. out of the annualised return of 9.0% averaged by the S&P500 is due to the changes in the multiple of earnings (ΔPER). The more we shorten our investment horizon, the bigger the weight that speculative returns have on TSR, not being uncommon to find any single year period in which variations in the multiple do not account for more than a third of the total movement of the markets.
To illustrate this, the table below breaks down the annual returns, since fiscal 2000, of the S&P500 index into its enterprise and speculative components, and then shows the weight that each of them has had on the total return each year:
Note how in 11 out of the 24 one-year periods (highlighted in green text), fluctuations in the multiple of earnings were the single strongest driver of market volatility, accounting for more than 30.0% in 16 of them.
On average, the speculative side of investing has been responsible for 43.8% of the total movement of the markets in any single year over the past two decades, which suggests that for the average investor it becomes a nearly impossible task to make sound investments if his horizon is of one year or shorter: while the changes of getting the speculative swings of the market in his favour are shy of 50.0% the first year, by the fifth consecutive attempt these are reduced to about 3.0% (2-5), and to less than 0.1% by the tenth iteration (2-10). The person aiming to play that game will certainly need more than a motivated mind to succeed in such endeavour.
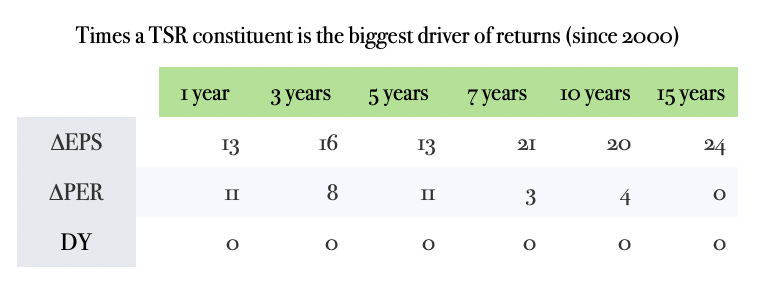
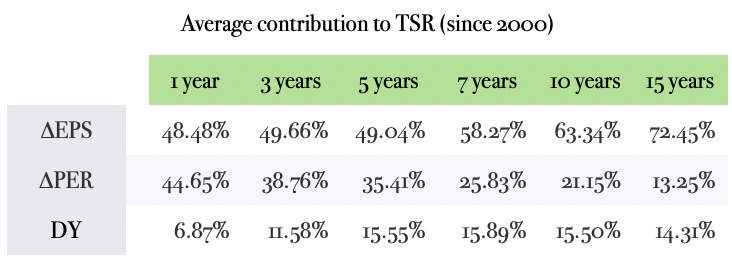
But what happens if we look at three-, five- and up to fifteen-year periods, rather than annually? An interesting pattern starts to emerge:
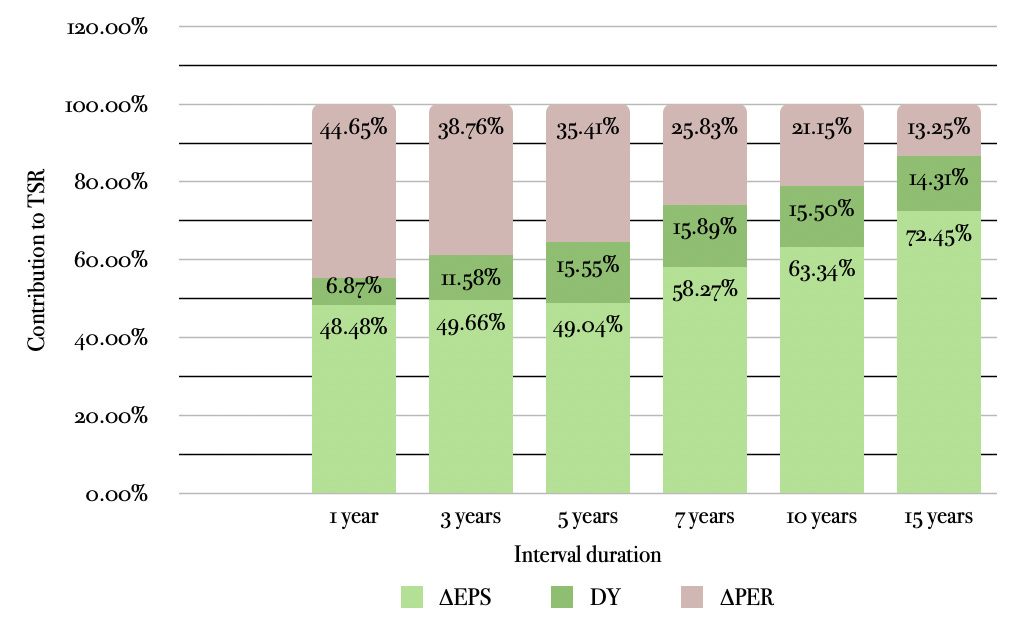
What these tables show is (a) the amount of intervals in which each of the TSR constituents is the biggest driver of returns and (b) the extent of the contribution to those same returns over different timeframes.
The times that the speculative engine was responsible for more than half of the total returns decreases from 11 when measured annually to 4 over any ten-year interval and, when stretching to fifteen-year spans, we find no single period in which fluctuations in the multiple of earnings account for the majority of the market performance. By combining this with the second table, we observe that not only it is less likely to reap a reward from long-term speculation but, when that happens, the prize for being right (or lucky) is much smaller. If we look at the average contribution that speculative returns have on TSR, this figure decreases sharply from 44.7% when measured in single-year intervals to 13.3% over fifteen-year spans.
This phenomena is no other than compounding at play. By assuming non-reinvested dividends and constant currency (U.S. dollars invested in the S&P500 index), the only TSR constituent which is susceptible to compound is the increase in per-share profits, as multiples of earnings tend to oscillate around a fixed point (circa fifteen times for the S&P500 on a historical basis). The longer the investment timeframe, the bigger the likelihood that the enterprise returns dwarf those of the speculative side.
There is still a question to be answered, though. If not reinvested dividends do not compound, why does their yield eventually overcome the returns derived from changes in the multiple of earnings? A hypothesis is that cash distributions only work in one way (i.e. from the company to its shareholders), while price-to-earnings variations can be positive or negative in any given period, increasing the probability of cancelling each other as the horizon stretches.
Far from being the exception, this effect also manifests itself in individual securities. Let’s switch to a practical study case on how TSR might be deconstructed for a specific company.
A practical case: Games Workshop.
Games Workshop (the British owner of the Warhammer brand) will serve us as an example for deconstructing the total shareholder returns since December 2010. For the task we are trying to accomplish there is no need to go further in the qualitative aspects of the company.
Games Workshop trades under the ticker GAW in the London Stock Exchange and, therefore, its stock is quoted in Sterling pound (GBP) or, rather, in GBX (Great British Pence). This is important because, since we want to cover all four constituents of the TSR, we will assume that a fictional investor in the company lives in the U.E., meaning that he would ultimately need to convert the proceeds to euro (EUR).
Assuming this person purchased 1,000 shares of Games Workshop’s stock at the end of natural 2010 (Games Workshop’s fiscal year ends in May) and held onto those shares to present days, how did he fare?
To determine the TSR over the thirteen-year period we require (a) the purchase price paid originally, (b) the current stock quotation (the price at which he could sell today) and (c) the dividend yield on the original investment.
After the close of the stock market on 28 December 2010, the company was quoted at £4.25. Fast forward to 19 January 2024 and each GAW share is now worth £97.50.
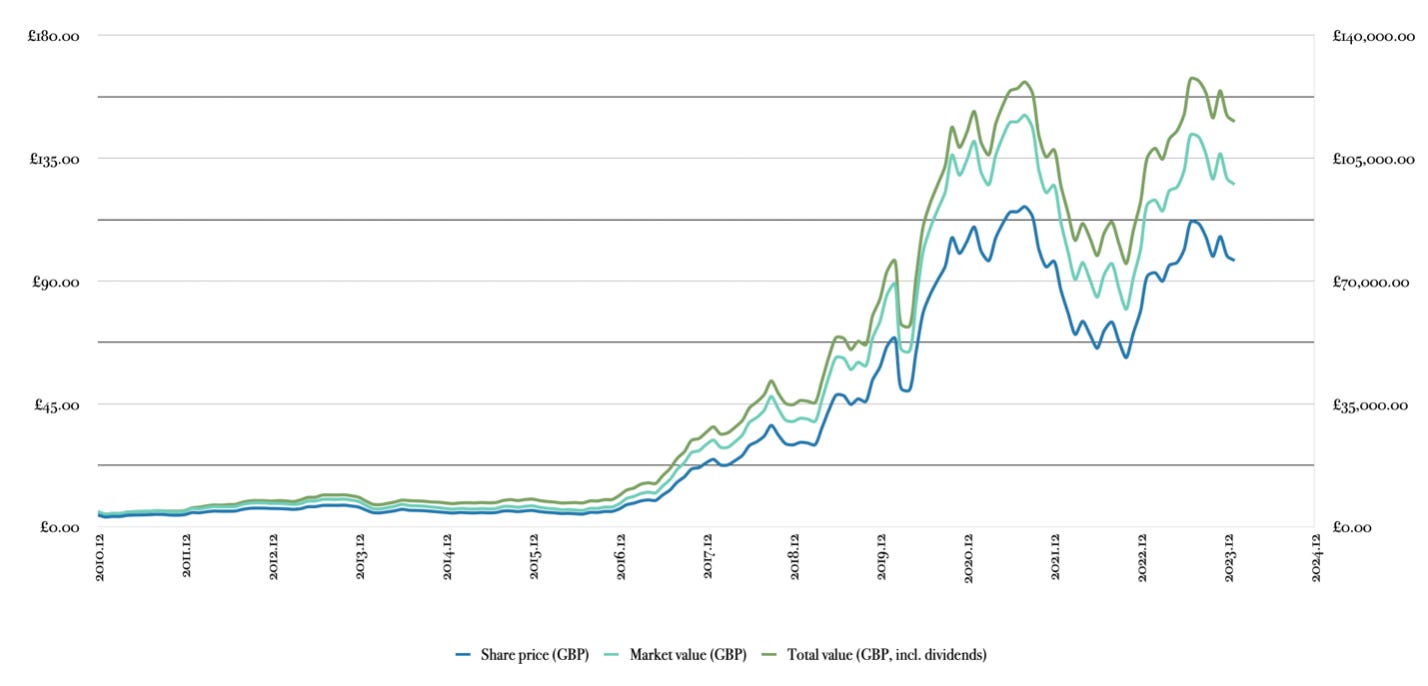
The chart below represents Games Workshop’s share price over the aforementioned period, the market value of the thousand shares that were purchased and the total dollar amount of its investment in local currency (i.e. in GBP) when factoring in the dividends as they are collected along the process:
To get a sense for the capital gains of the above chart, £4,250.00 exchanged for a thousand shares in December 2010 have a market value today of about £97,500.00 without considering dividends, or £115,430.00 including the £17,930.00 cash distributions that our investor has collected since. Leaving aside such spectacular appreciation of capital, the TSR calculation in local currency would look like this:
TSR (£) = £97.50/£4.25 + £17,930.00/£4,250.00 - 1 = 2,616.0%
That is in Sterling pound. If we want to adjust for the currency fluctuations and convert the above result to euro, we then need to know the exchange rate at which our investor made the original purchase, its current value and the GBP/EUR conversion rate at the moment of every dividend payment. To spare the reader of what would be a kilometric table such as the one containing the dividend dates, their dollar amounts and their conversion to euro since December 2010, I encourage you to trust me and take the following data as reliable enough: the exchange rate between Sterling pound and euro on the purchase date (i.e. 28/12/2010) was 1.1765, it currently sits at 1.1675 and, by converting every dividend payment to euro, the resulting cumulative amount adds to €20,799.80.
Knowing this, a more realistic TSR enjoyed by this person has been:
TSR (€) = (£97.50/£4.25)*(1.1675/1.1765)+€20,799.80/(£4,250.00*1.1765)-1 = 2,592.5%
In euro terms, our investor has multiplied his original investment by 26.9 times, which represents a compounded annual rate of return of 28.8%.
This figure, although useful for certain purposes, does not tell us much about the evolution of Games Workshop’s enterprise, that is, the development of the underlying business over that time frame. It could be the extreme case that the entirety of the TSR derived from the speculative side in the event that its price-to-earnings ratio expanded from one time profits to twenty-seven times without any growth in economic profits nor dividend distributions.
Being able to break the TSR down into its main pillars is of pivotal importance for the average investor, especially so in navigating distressed markets: it is far easier to remain unaffected by Mr. Market’s short-term volatility if we focus on the performance of the underlying operations of the company, rather than on the colour of its daily price chart.
In order to deconstruct the TSR figure above, we can start by applying what we have seen about its constituents:
TSR = (1 + ΔEPS) * (1 + ΔPER) * (1 + ΔFX) + DY
Increase in earning power (ΔEPS):
Games Workshop’s per-share profits grew from £0.48 in the twelve months before December 2010 to £4.23 in the twelve-month period prior to January 2024. At constant currency, our investor enjoyed an almost nine bagger on its original investment from the increase in earning power of the business alone:
ΔEPS = £4.23/£0.48 - 1 = 781.3%
Multiple expansion (ΔPER):
The company’s stock traded at 8.85 times profits at the time of the purchase (£4.25 divided by £0.48), compared to a valuation of 23.05 times its statutory earnings today (£97.50 divided by £4.23). This rerating has allowed our investor to enjoy unrealised capital gains from the expansion of the earnings multiple in the order of:
ΔPER = 23.05/8.85 - 1 = 160.3%
Currency fluctuations (ΔFX):
The relationship between the Sterling pound and euro has stayed roughly flat over the thirteen-year time frame, starting on 28 December 2010 at 1.1765 and ending on 19 January 2024 at 1.1675, so the impact on the investment from variations in the exchange rate is minimal:
ΔFX = 1.1675/1.1765 - 1 = -0.8%
Dividend yield (DY):
As we have already seen, the collected dividends (not reinvested and converted to euro) on the original investment have yielded:
DY = €20,799.80/(£4,250.00 * 1.1765) - 1 = 416.0%
By applying the above components to the equation, we get the following composite return (in euro terms):
TSR (€) = (1 + 7.81) * (1 + 1.60) * (1 - 0.008) + 4.16 - 1 = 2,592.5%
It shall not come as a surprise that the TSR result obtained here is identical to the one calculated previously (in euro terms). It mathematically cannot be otherwise, as the two equations are the same. All we have done is breaking its first component (i.e. capital gains) down into growth in per-share earnings and changes in the valuation multiples applied to those same profits.


