Commentary.
There were a few relevant events throughout the past month:
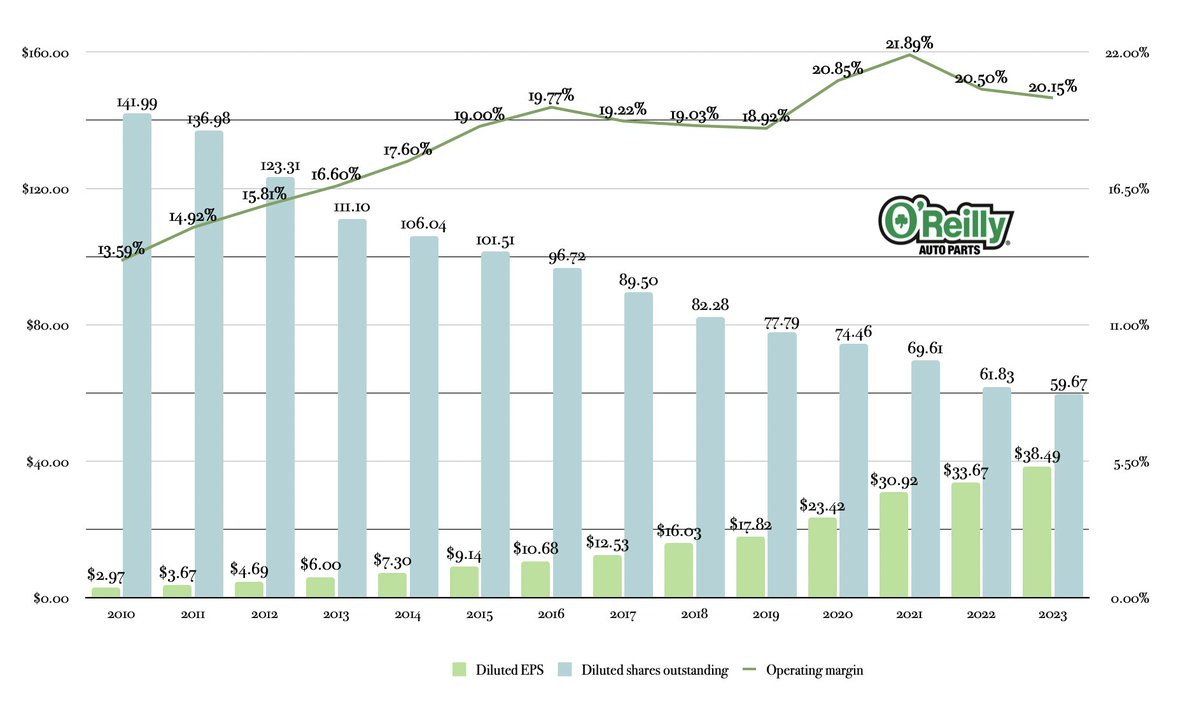
Fiscal 2023 was another record year for O’Reilly, delivering increases of 9.7% and 14.3% in sales and per-share profits, respectively. With roughly flat profitability levels, this difference is primarily explained by the effect of share buybacks (a further 3.5% reduction of the total pool compared to fiscal 2022).
The picture below depicts O’Reilly’s flywheel since its capital allocation strategy shifted towards consistent share repurchases in fiscal 2010:
Brookfield’s own invested capital amounted to US$132.9 billion at year end (19.5% higher than that of fiscal 2022) and distributable earnings before realisations per share, after adjusting for the special distribution of a quarter of its asset management business, grew by 8.3% throughout fiscal 2023. The only operating business that lacked behind was its property subsidiary (i.e. BPG), primarily as a consequence of a higher cost of debt capital.
ZIGExN reported increases of 21.7% and 49.0% in revenues and earnings per share (respectively) for the third quarter of its fiscal 2024. Over a rolling twelve-month period, I estimate its intrinsic value to have grown by 44.7%.
Water Intelligence published a press report on February 15th providing an update for fiscal 2023. Over the year, the group increased revenues by 6.5% and EPS by around 13.0%.
Performance.
Notes:
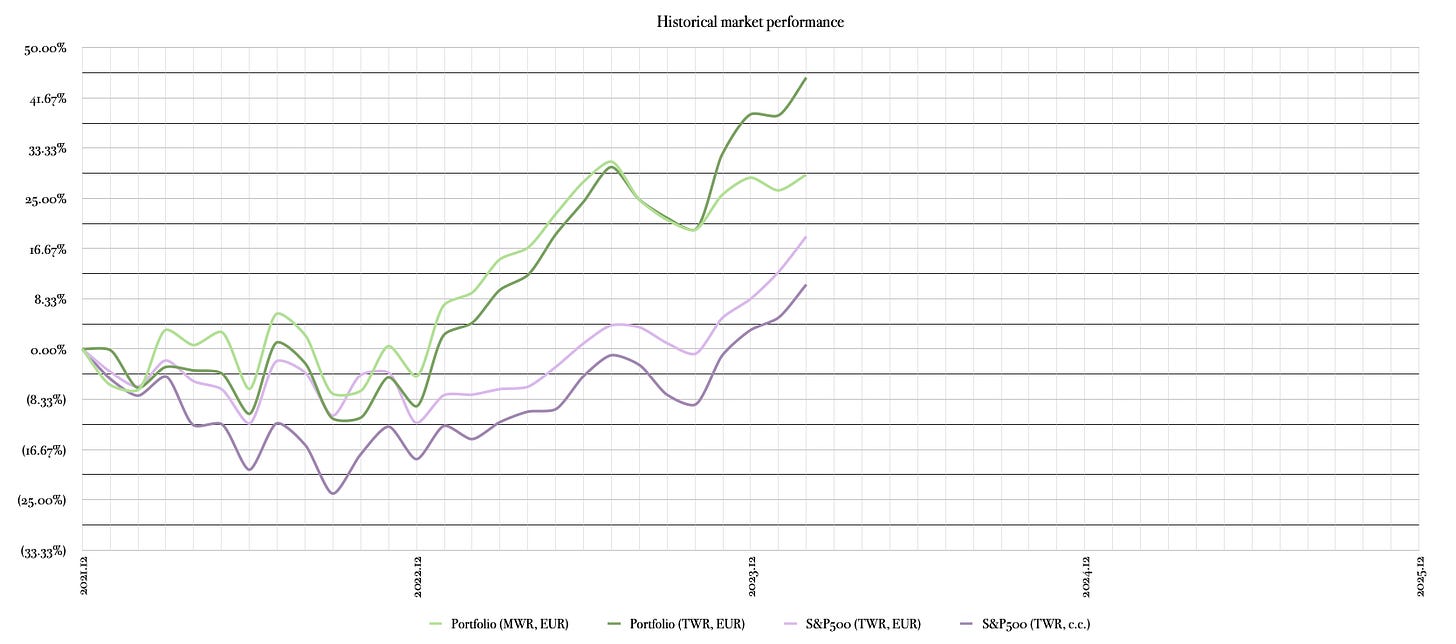
Performance is measured following the money-weighed return (MWR) methodology.
Unless otherwise indicated, performance values are expressed in EUR terms.
The market quotation of the portfolio increased by 4.6% in February, leaving the year-to-date performance at 4.5% and at 28.9% since inception in January 2022 (12.4% annualised). In TWR terms, the performance since inception has been 45.0% (18.7% annualised).
Comparatively, the S&P500 appreciated 5.2% in February, 9.6% since the start of the year and 18.7% since January 2022 (8.2% annualised).
Contributors.
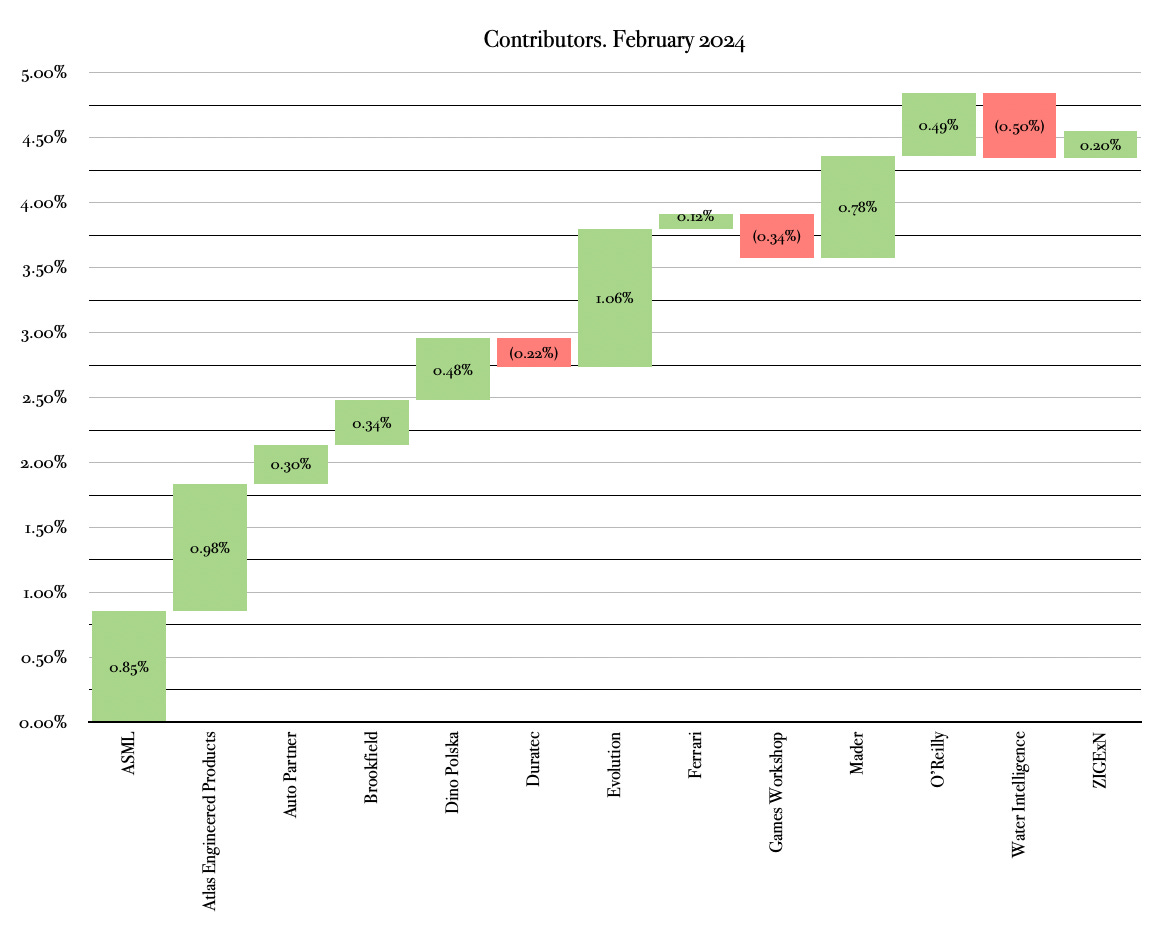
The following table shows the top contributors and detractors to market performance on a weighted basis and converted to EUR during different time frames: last month, year to date (YTD) and inception to date (ITD):
The waterfall charts below are included for a more detailed breakdown of the individual contribution of each holding:
Activity.
There has been no activity during the period.
Content consumed during the period.
Some curated content whose read was enjoyable last month:
Articles:
Musings on the attribution of total shareholder returns (Tristan Waine).
Books:
Capital allocation (David Giroux).
Diamonds in the dust (Saurabh Mukherjea).
How to get lucky (Max Gunther).
Junk to gold (Willis Johnson).
Never split the difference (Chris Voss).
The John Deere way (David Magee).


