Performance.
Notes:
Performance is measured following the money-weighed return (MWR) methodology.
Unless otherwise indicated, performance values are expressed in EUR terms.
The market quotation of the portfolio increased by +4.57% in July, leaving the year-to-date performance at +38.07%.
This compares to a +1.66% for the S&P500 non-financials (SPXN) last month and +19.97% since the start of the year.
ITD:
Since inception in January 2022, the total return has been +31.09% or an annualised rate of +18.65%.
This compares to a +4.61% for the SPXN over the same period or +2.89% in annualised terms.
Recently I was asked why I utilise MWR to measure performance given its tedious calculation process (compared to TWR). I will try to summarise it in the following paragraphs.
I believe MWR, as of today, represents my reality in a more accurate way than that pictured by TWR due to a variety of reasons: the main source of income is still my job and my savings power is not yet insignificant when compared to the NAV of the portfolio, so the periodic contributions tend to smooth out the performance (on a comparative basis) when using MWR. To provide an example on this, should I use TWR as the reporting method, returns year to date would be +43.85% (instead of the stated +38.07%) but -in my view- that is not as realistic as the second figure, which accounts for the timing of contributions.
TWR ignores the timing of inflows and outflows so I believe its use is best reserved for the cases when (a) the investor is not in control of when the cash flows happen (e.g. a fund manager) and/or (b) the NAV of the portfolio is sufficiently large compared to the potential contributions. Regarding (b), I consider this to be the case for NAVs greater than 20.0 times the annual contribution (as of today the portfolio’s NAV sits around 8.0 times my annual contributions rate). Of course there are nuances to this, as depending on the attractiveness of the market inflows to the portfolio may vary throughout any given year. On average, I estimate 80.0% of personal savings go to the “available for investing” bucket, which is then deployed or kept as cash depending on opportunities at hand. Another nuance is where that cash is deployed, as I see no difference in the fundamentals between investing in publicly traded companies or real assets (in a more physical sense). Whatever seems more attractive at the time.
As the portfolio becomes more sizeable, it will inevitably cross a threshold as of which new contributions will not move the needle much, thus reducing the discrepancy between MWR and TWR returns.
When such day arrives I will consider switching the reporting method from MWR to TWR, given the relative simplicity of the latter.
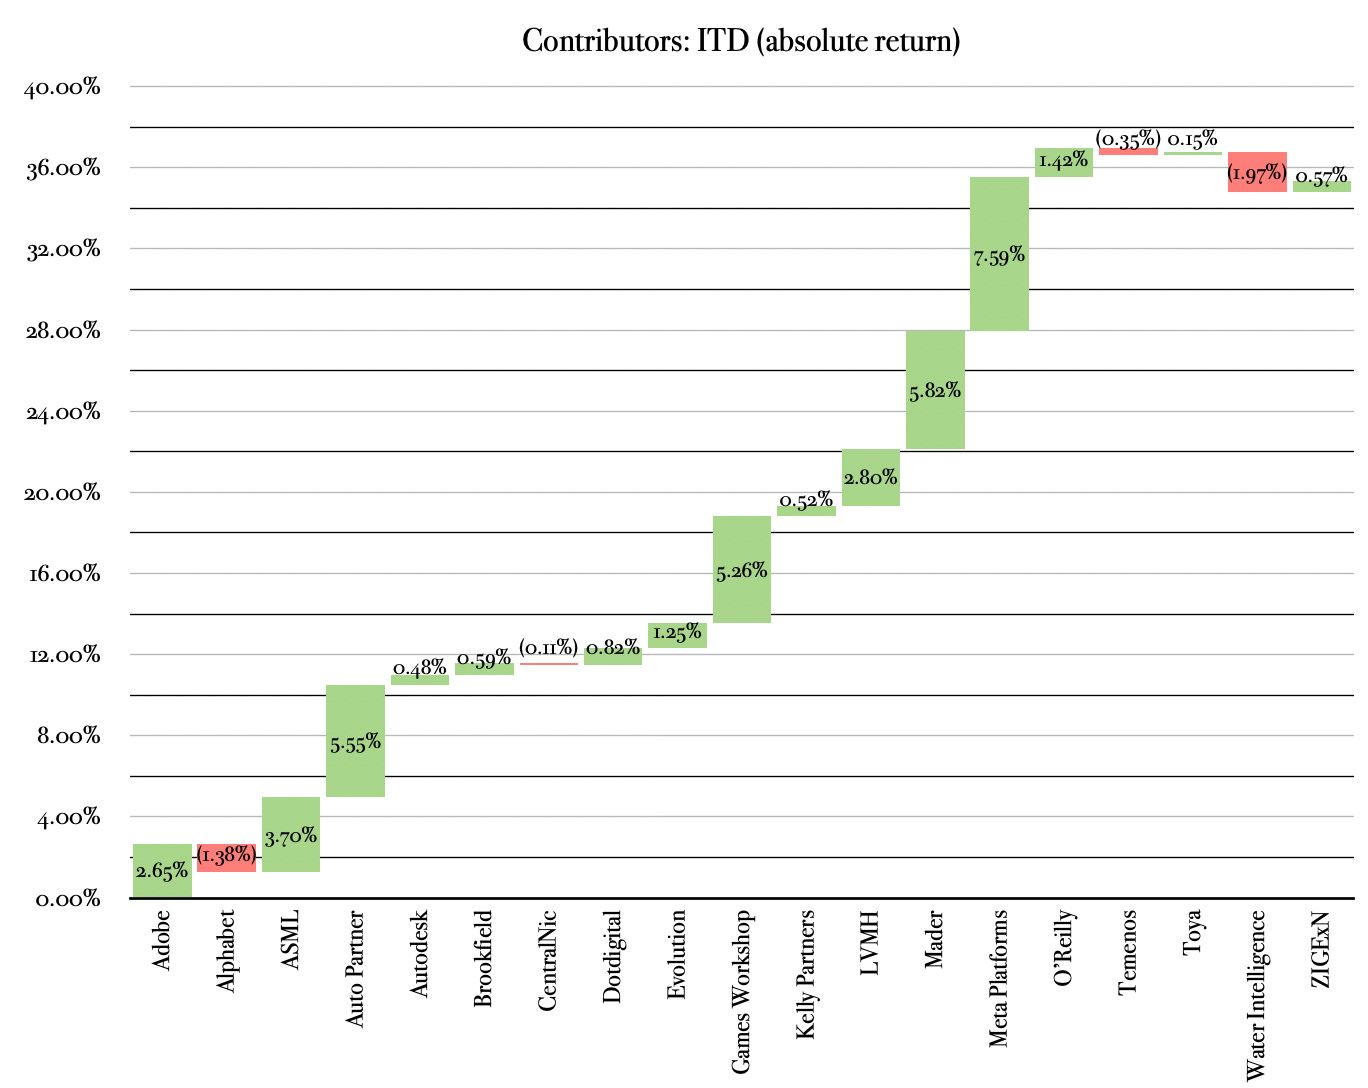
The Contributors section below is calculated using TWR (I like math but not enough to calculate these via MWR), so switching the performance report of the entire portfolio to TWR would also match the end-value of the waterfall charts included in that section.
I hope this provides some insight on why MWR is the preferred reporting method under today’s circumstances. In any case, I thank you for these questions as they serve as sparks for reflection and thought.
Contributors.
The following table shows the top contributors and detractors to market performance on a weighted basis and converted to EUR during different time frames: last month, year to date (YTD) and inception to date (ITD):
The waterfall charts below are included for a more detailed breakdown of the individual contribution of each holding:
Activity.
Stake in Toya was increased by 26.7%.
Content consumed during the period.
Some curated content whose read was enjoyable last month:
Articles:
All you need to know about semiconductors (Best Anchor Stocks).
Basic-Fit N.V. - One Pager (From $100k to $1M).
Begbies Traynor (Hurdle Rate).
OneWater Marine (Mexican Investor).
Zedcor (Margin of Safety Investing).


Appreciate the mention and keep rocking it 😎 good performance!
Astonishing asset allocation, nicely balanced.